Human systemsCase study

Virtis™ SNM

A self-initiated, no-budget redesign of a sacral neuromodulation clinician app that treated the software, the clinic, and the sales model as one system. Informal prototype testing showed a 62% improvement in task performance.

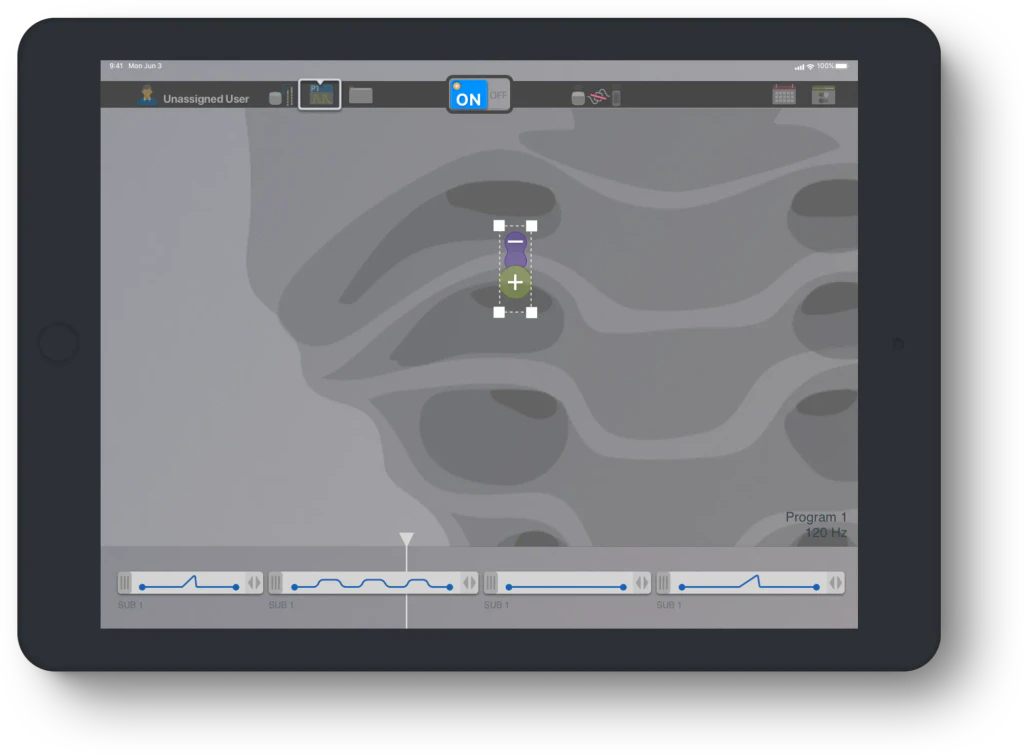
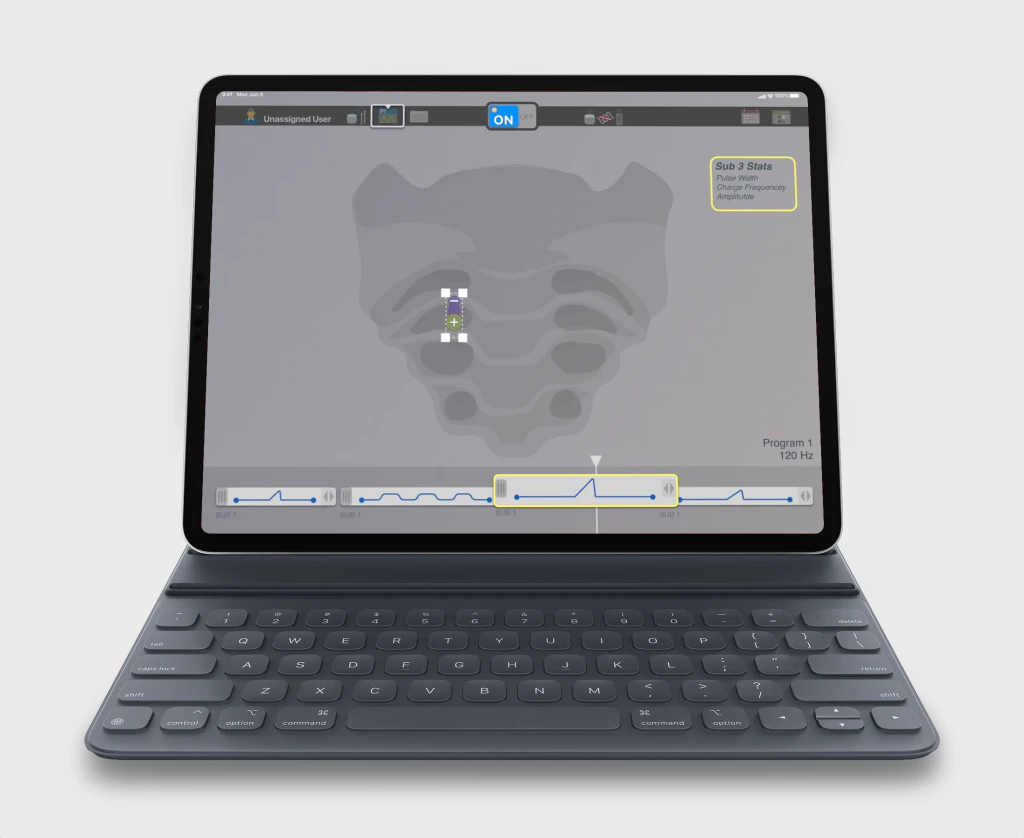
Virtis SNM on a tablet: sacrum lead view above a timeline of therapy programs

At a glance

Problem
Therapy-programming software built on engineering logic was hard for clinicians to learn and expensive to support.
My role
Proposed the redesign and owned UX, usability engineering, UI, and interaction design.
Result
62% better task performance in informal prototype testing; clinicians preferred the new timeline model.
Client
Nuvectra
Role
Proposer and sole designer — UX, usability engineering, UI, interaction design
Timeframe
2018
Team
Solo; stakeholder and engineering buy-in
Disciplines
Biotech · Mobile · Usability Engineering
Outcome
62% better task performance (informal prototype testing)
Client
Nuvectra
Role
Proposer and sole designer — UX, usability engineering, UI, interaction design
Timeframe
2018
More details
Team
Solo; stakeholder and engineering buy-in
Disciplines
Biotech · Mobile · Usability Engineering
Outcome
62% better task performance (informal prototype testing)

Context

Virtis™ SNM configures an implanted stimulation system that treats bladder and bowel problems. Clinicians use its programmer app to set and adjust a patient’s therapy.

As the organization was winding down, I proposed a complete redesign of the SNM software rather than sit idle. It was a “blue sky” interface that kept the same core requirements but carried forward everything I had learned on Nuvectra’s other neurostimulation interfaces.

Problem

The software spoke engineer; the people using it were clinicians. Earlier neurostimulation interfaces were designed by engineers to fit engineering methods, and user polls showed few clinicians had an engineering background. That mismatch didn’t stay on the screen. It cost money at every step downstream.

  1. Engineering-first interfaceParameters and jargon too technical for many users.
  2. Hard to learnNew clinicians struggled to understand the therapy system.
  3. Costly to train and supportClinicians were expensive to train and to keep proficient.
  4. Reps stretched thinSessions and travel capped how many patients a rep could cover.
  5. Revenue held backEach cost above came out of the business.
From my observation notes on earlier Nuvectra projects: the interface problem was a system problem.

Underneath that chain, the interface itself was the starting point:

  • Therapy programming was convoluted, with unexpected interactions.
  • The interface was intimidating and overwhelming.
  • Interface language used jargon too technical for many users.

Constraints

  • The project lived outside standard operating procedure, so the primary constraint was stakeholder acceptance of breaking existing therapy-software paradigms.

  • It had to keep the functional requirements of the existing SNM software.
  • No budget beyond my own salary: no dedicated research or validation resources.

What I did

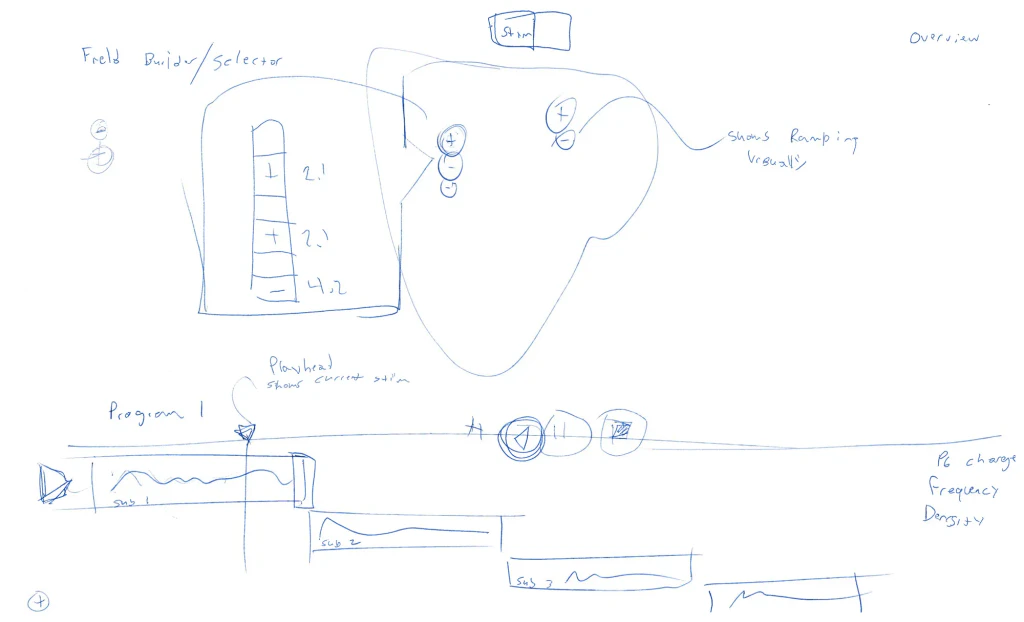
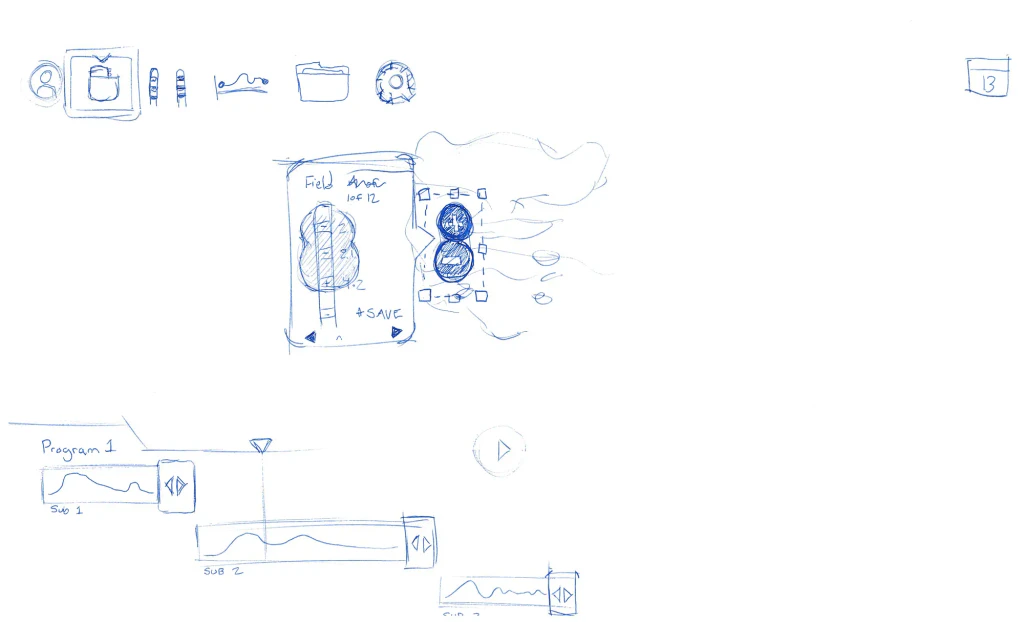
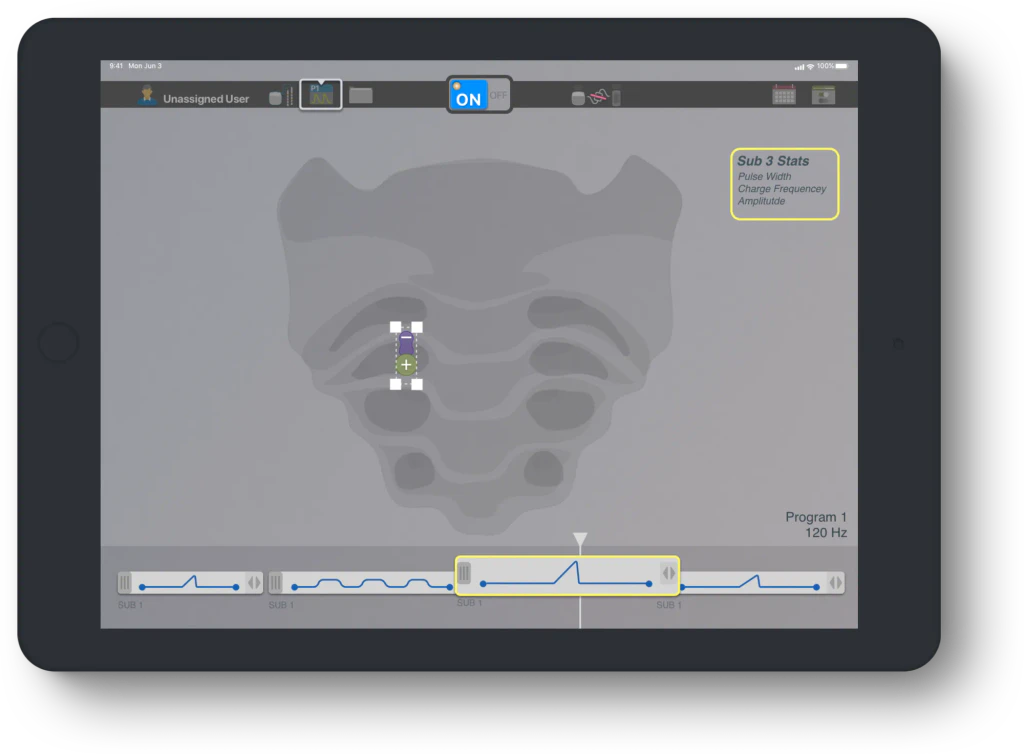
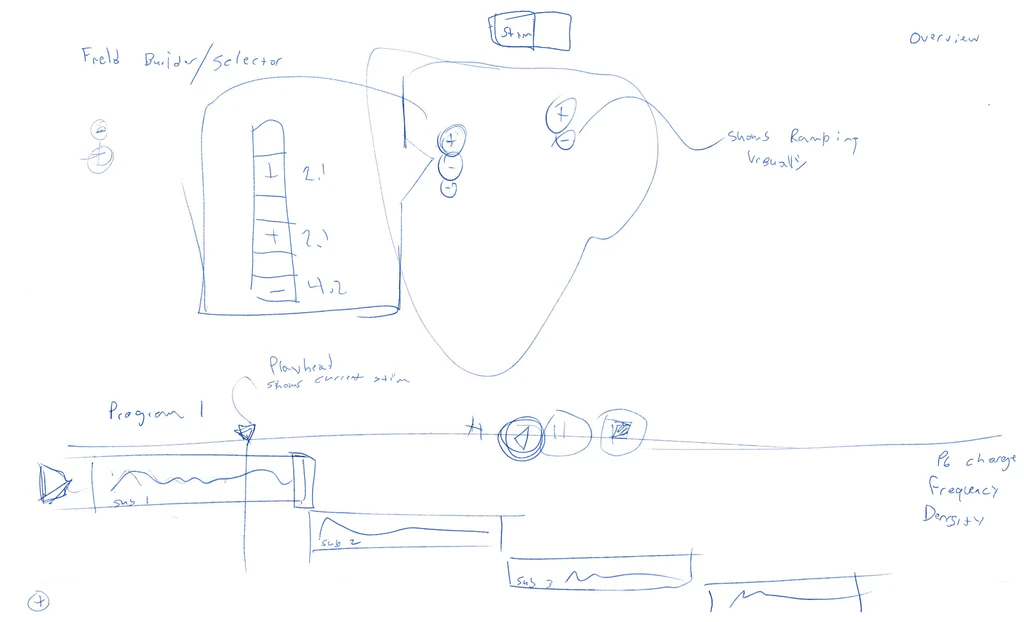
The key move: program therapy on a timeline. Instead of exposing engineering parameters, I borrowed a mental model from video editing. A program becomes a sequence of sub-program clips under a playhead, and the electrical field is shown directly on the anatomy. Anyone who has trimmed a video can read it.
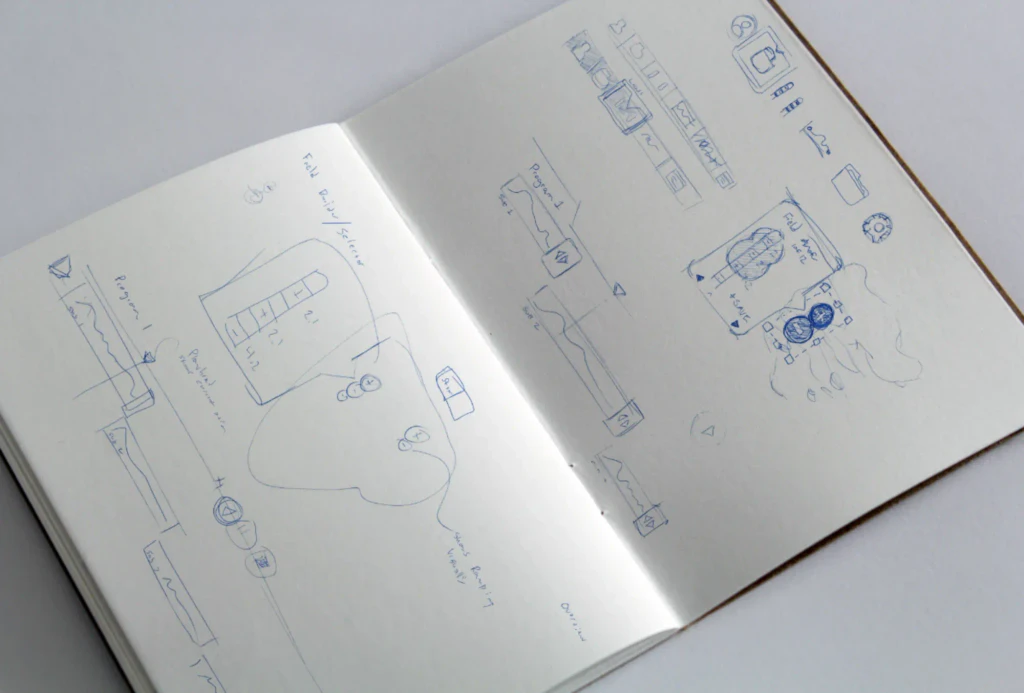
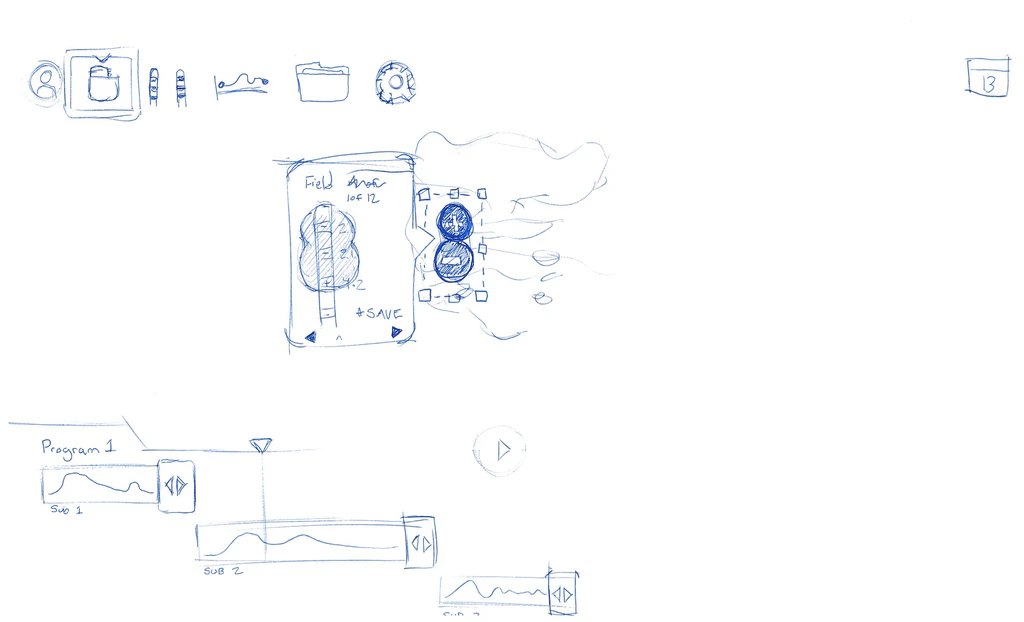
Open sketchbook with pen sketches: a field builder, and Program 1 drawn as stacked sub-programs under a playhead
Where it started: a field builder and Program 1 sketched as sub-programs under a playhead, before any pixels.

First pass

Pen sketch: a field builder and selector panel beside the sacrum, and Program 1 drawn as three sub-program clips under a playhead labeled shows current stim

Refined

Cleaner pen sketch: a row of toolbar icons, a field anchor panel next to the lead contacts, and Program 1 as staggered sub-program clips with a play button
The same idea, drawn twice: the playhead and stacked clips survived from the first pass, and the toolbar and field controls took shape in the second.
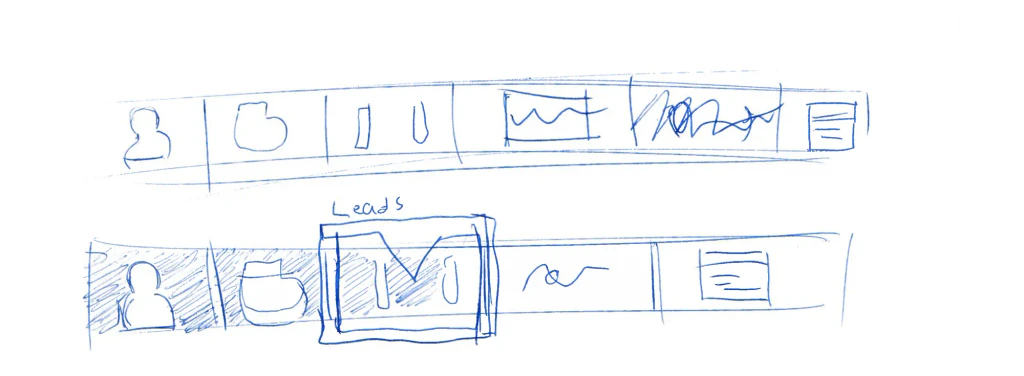
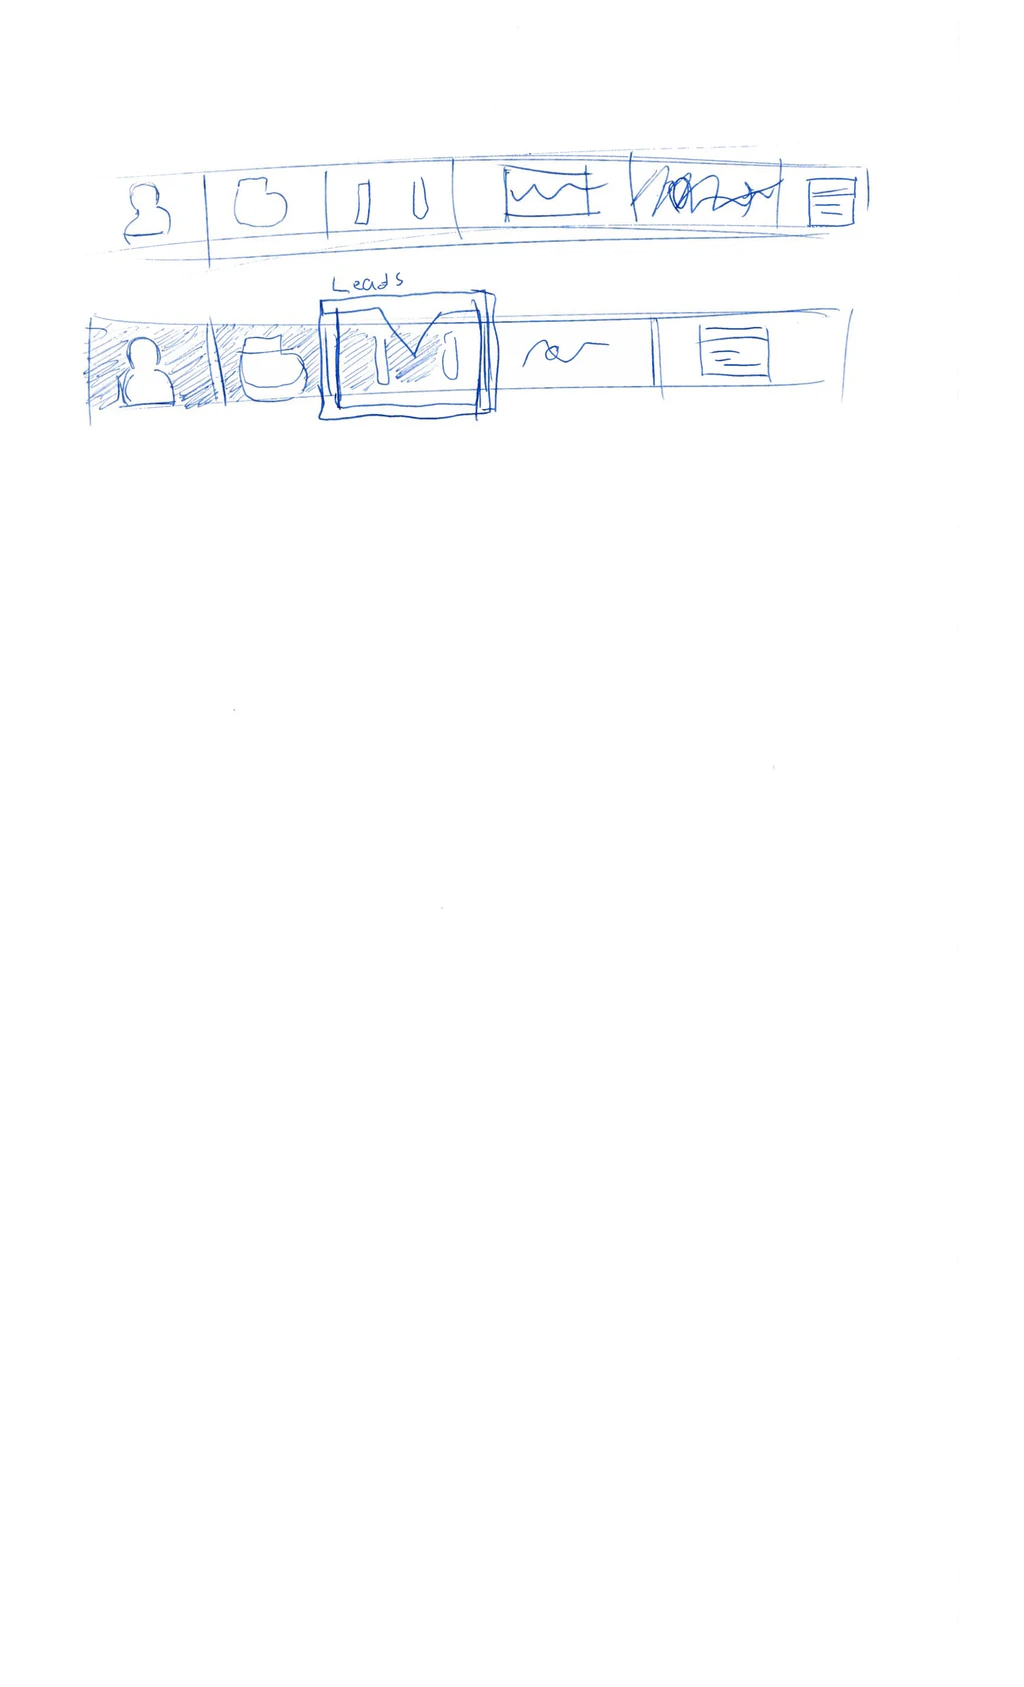
Two pen sketches of the app toolbar: a row of tabs for patient, implant, leads, waveform, and notes, with the Leads tab selected in the second
Toolbar sketches: one row of tabs for the whole session, with Leads selected in the second pass.
Virtis on an iPad: lead contacts on a sacrum illustration above a timeline of four sub-program clips with a playhead
Program 1 as a timeline. The lead sits on the anatomy; each clip is a sub-program, and the playhead shows what is stimulating now.
The same screen with sub-program 3 selected and a stats card showing pulse width, charge frequency, and amplitude
Editing a clip: select a sub-program and its parameters (pulse width, charge frequency, amplitude) appear in context.

One clip

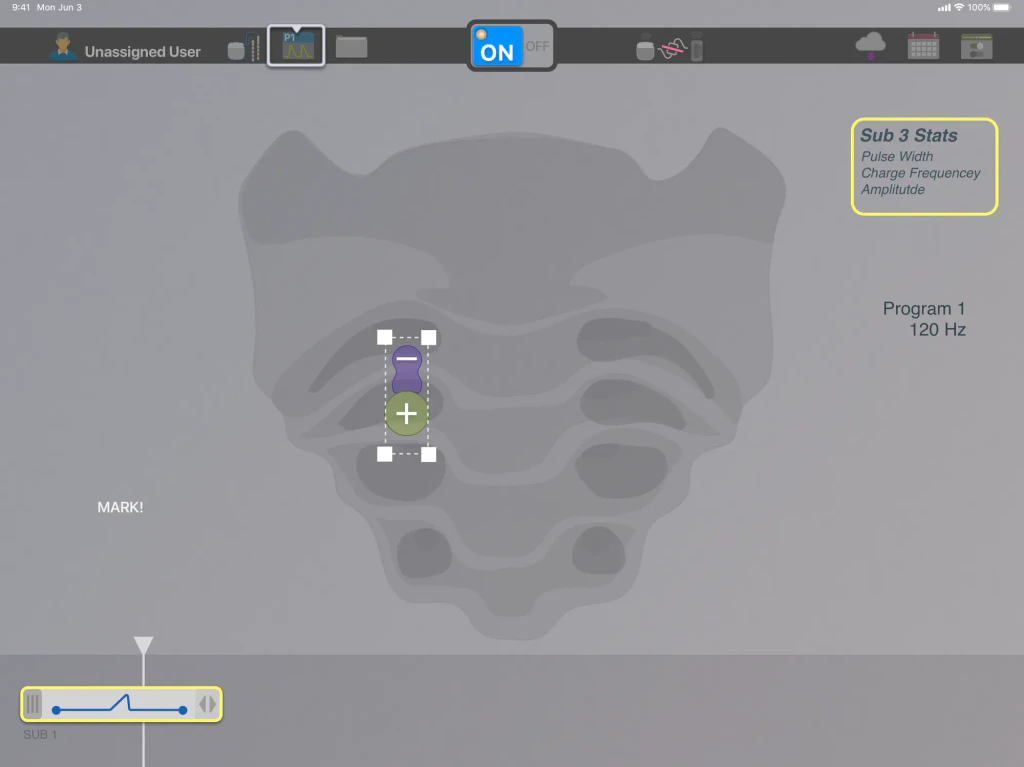
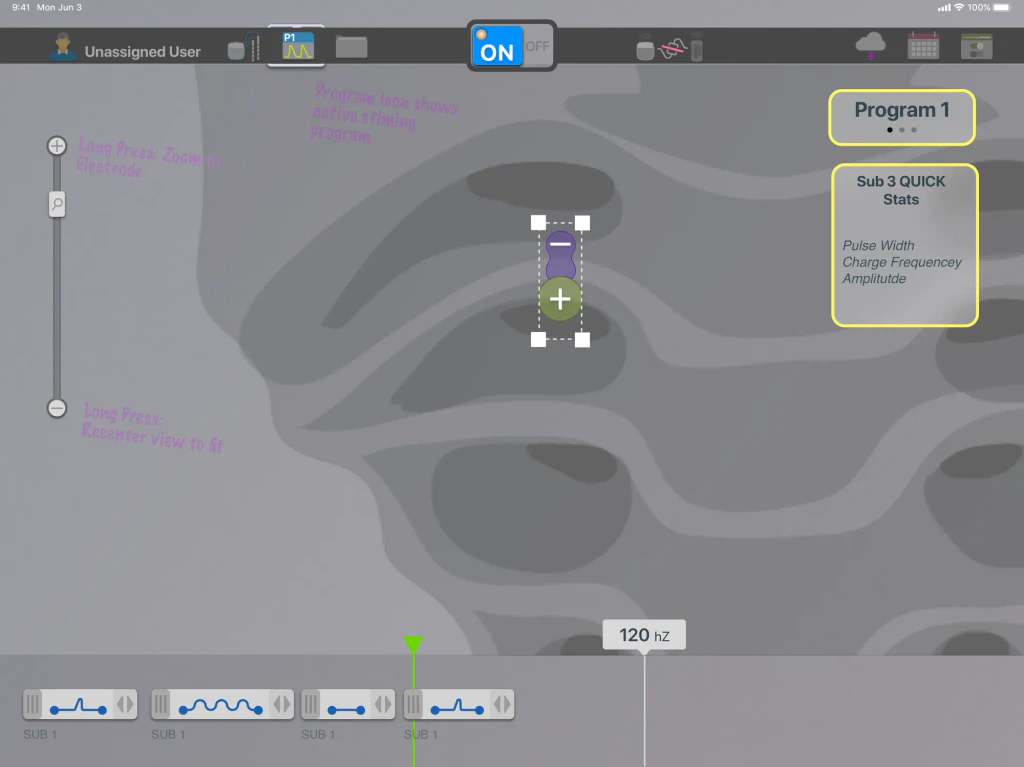
Programming screen with a single sub-program clip on the timeline and a small field selected on the lead over the sacrum

Field on the lead

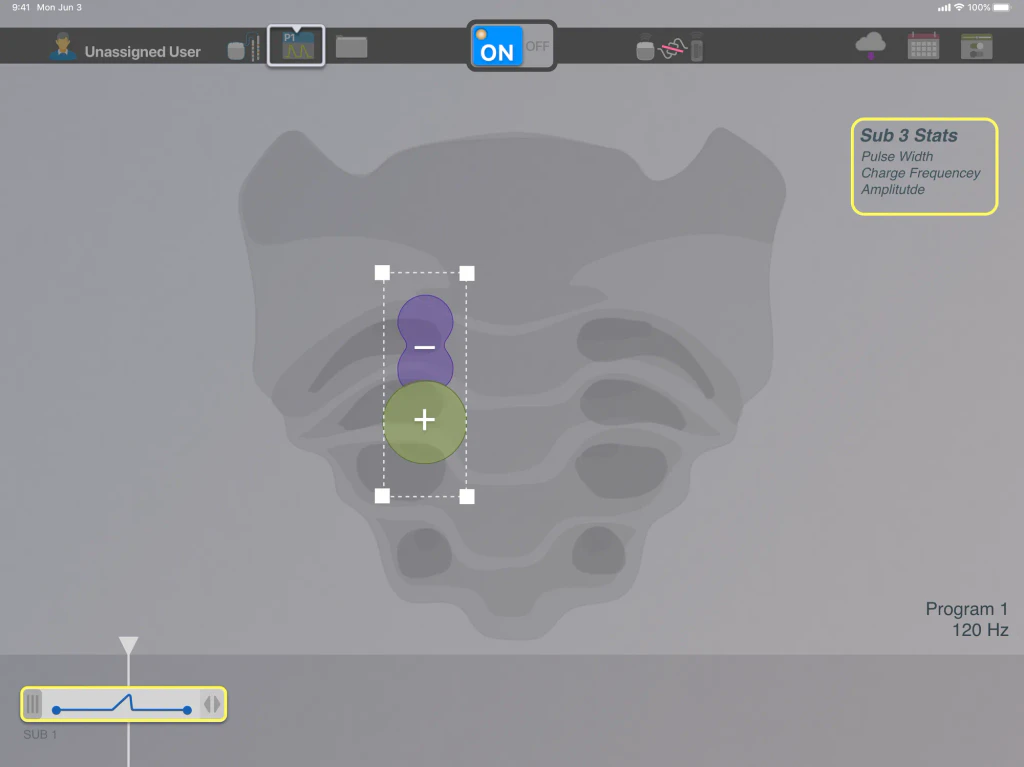
The same screen with the field on the lead enlarged inside its selection handles
Building a program: start with one sub-program clip, then work the field directly on the lead instead of in a parameter table.
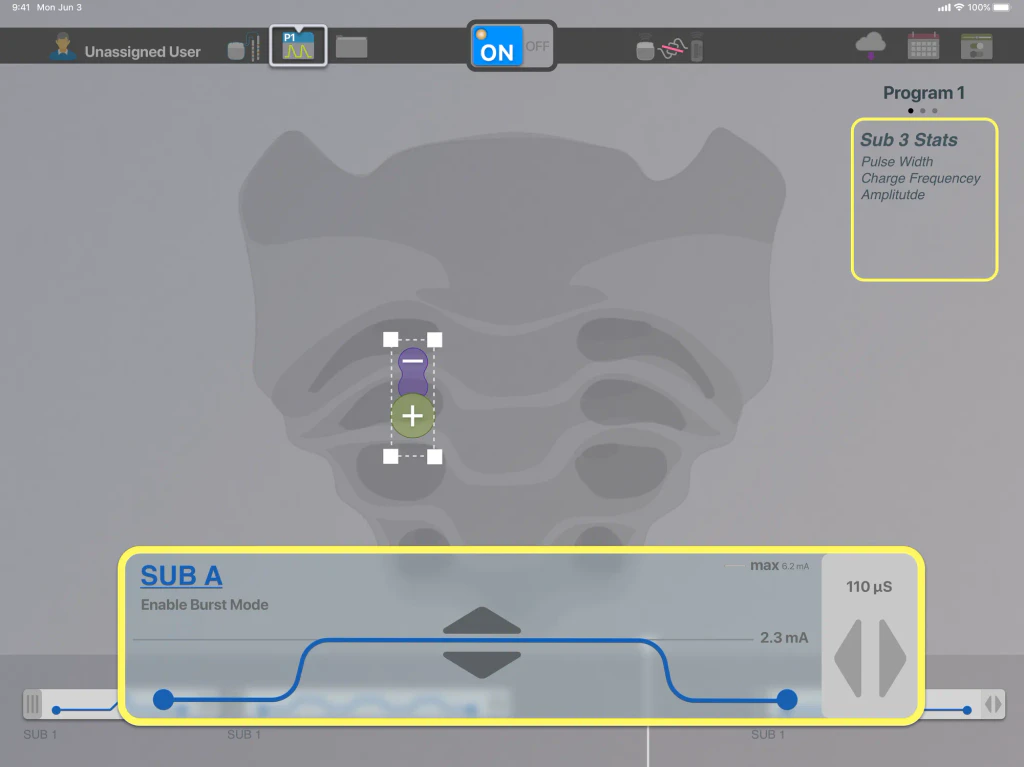
A sub-program clip expanded into an editor: its waveform, Enable Burst Mode, 2.3 mA amplitude against a 6.2 mA max, and a 110 µs pulse width control
Clip detail: a sub-program opens into its waveform, with amplitude, pulse width, and burst mode set in one place.
Zoomed programming screen with handwritten prototype notes: long press the zoom slider to zoom to the electrode or recenter the view, and the program icon shows the active program
Interaction notes on the prototype: long-press the zoom control to jump to the electrode or recenter, and the program icon shows what is running.

Then I designed the rest of the system around it. I turned the research into a strategy that treated the software, the clinic, and the sales model as one system:
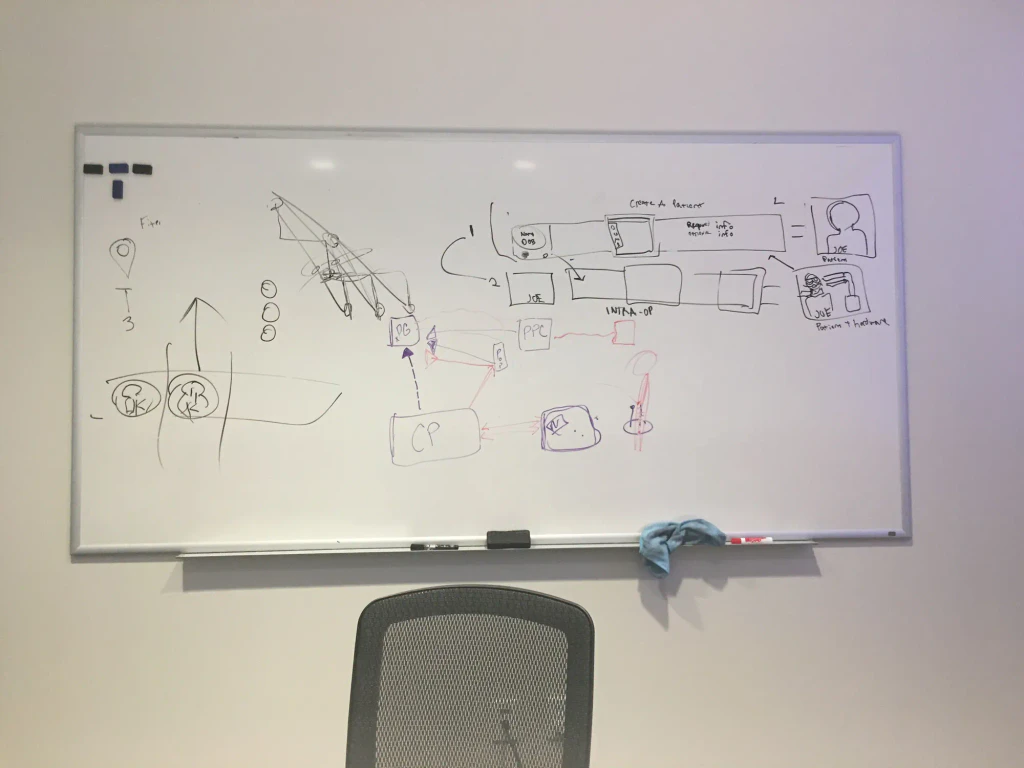
Whiteboard sketch connecting the clinician programmer, patient devices, and implant, beside an early create-a-patient flow with patient and hardware screens
On the whiteboard: how the clinician programmer, patient devices, and implant connect, next to an early create-a-patient flow.
  • Used heuristics and affordances from existing mental models to make the application easier to learn.
  • Simplified the flow into task-based, contextual workflows and removed unnecessary tasks and features.
  • Built a redundant visual communication system (shape, color, context, and text) for clinicians with impairments.
  • Designed a scheduling flow into the app so sales reps could cover more patients with less travel.
  • Proposed remote programming (telehealth) and a secure, cloud-based patient metric system as next steps.
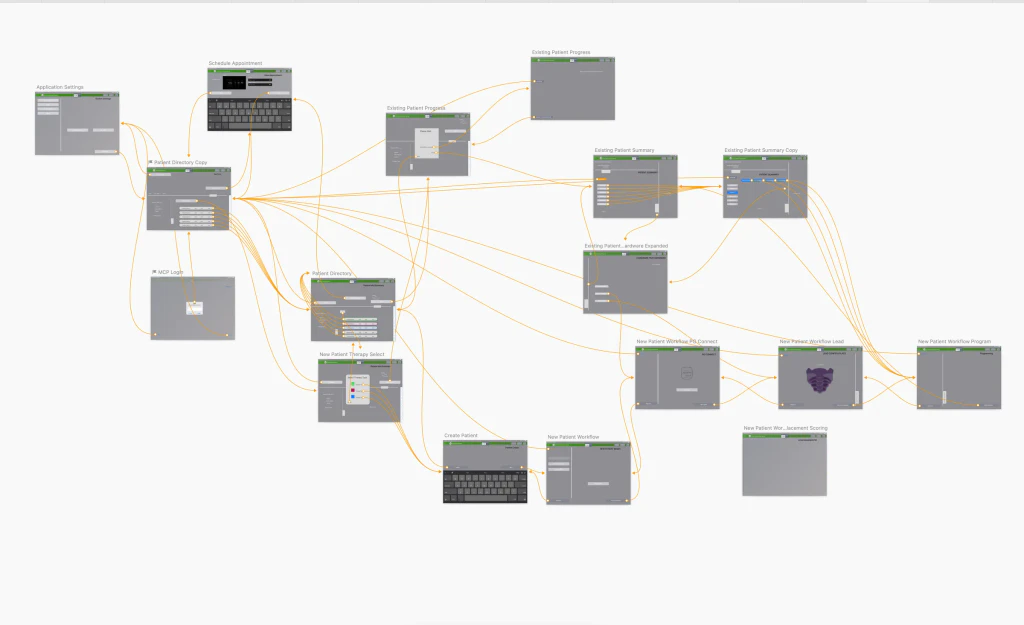
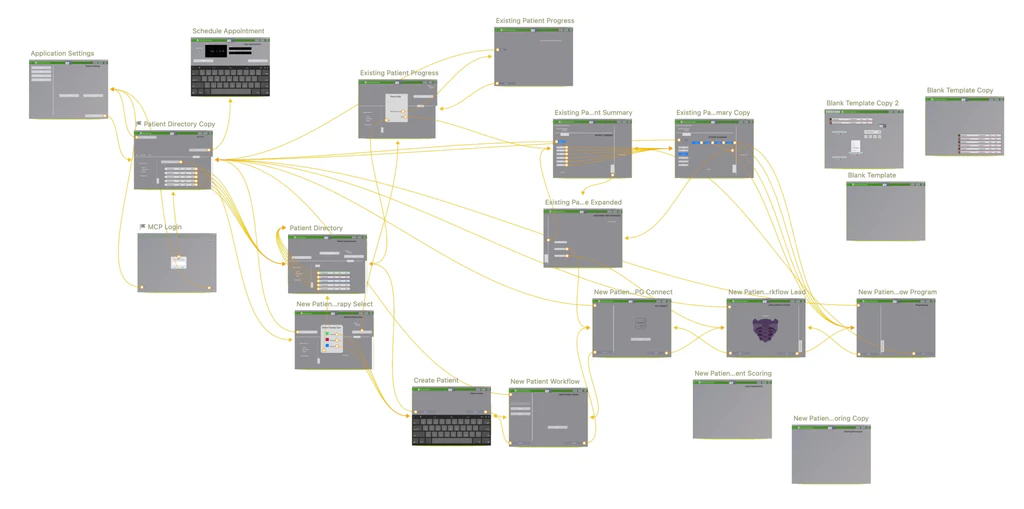
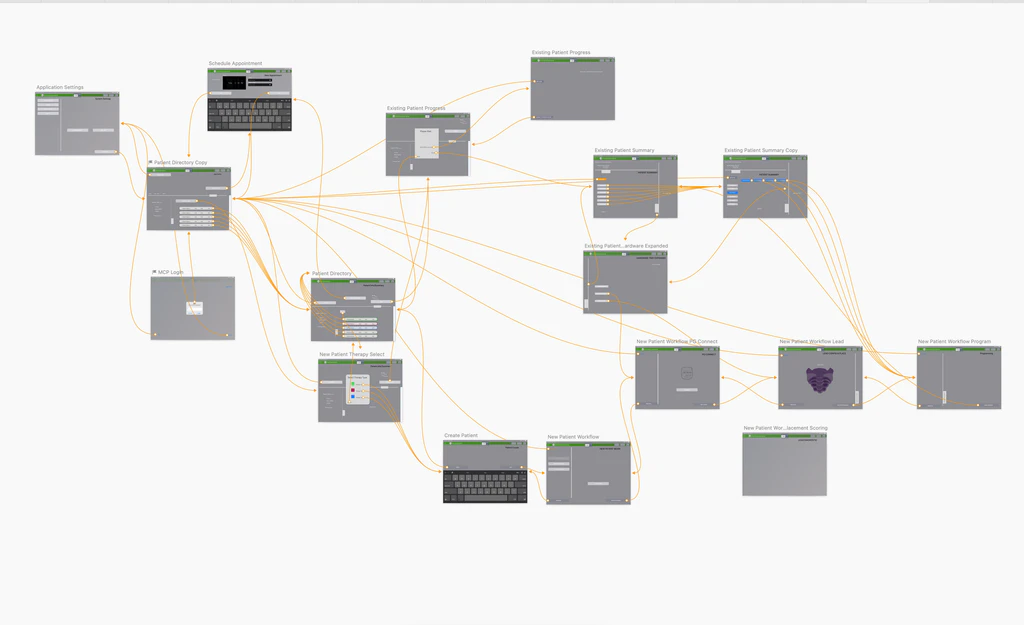
Sketch user-flow map connecting about twenty screens: login, patient directory, new patient workflow, programming, patient summary, and schedule appointment
The task-based flow: login, patient directory, new-patient workflow, programming, progress, and appointment scheduling, mapped end to end.
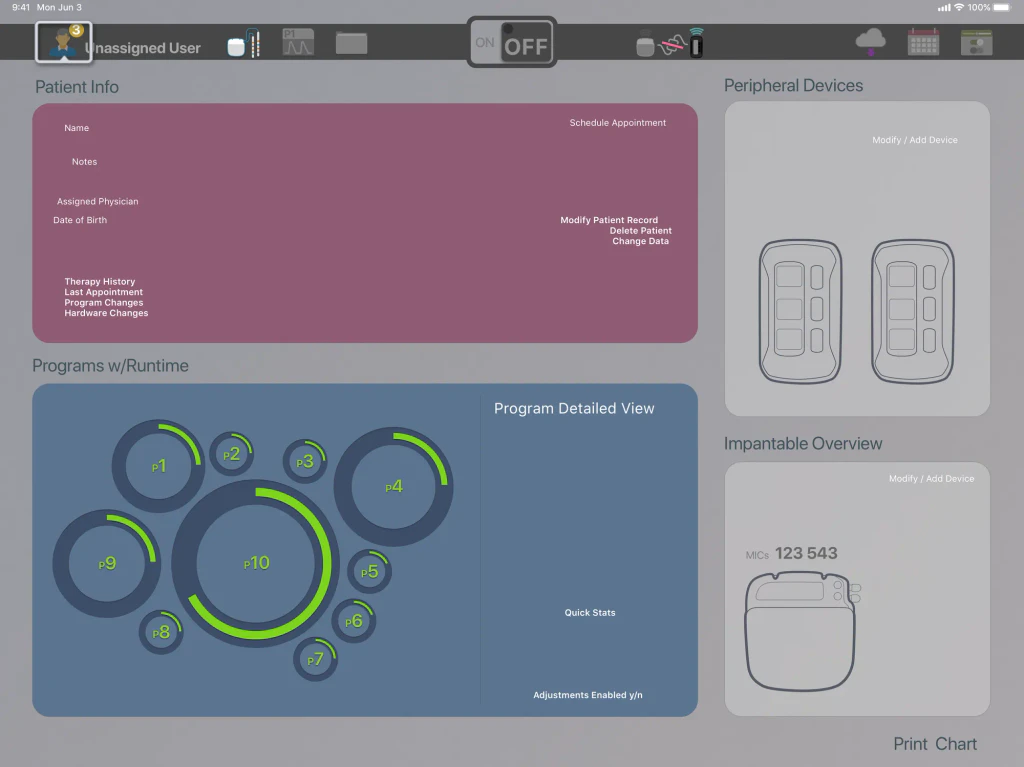
Patient summary screen: patient info and therapy history, ten programs shown as rings sized by runtime, and panels for peripheral devices and the implant
Patient summary: who the patient is, what changed last visit, how long each program has run, and which hardware they carry, on one screen.

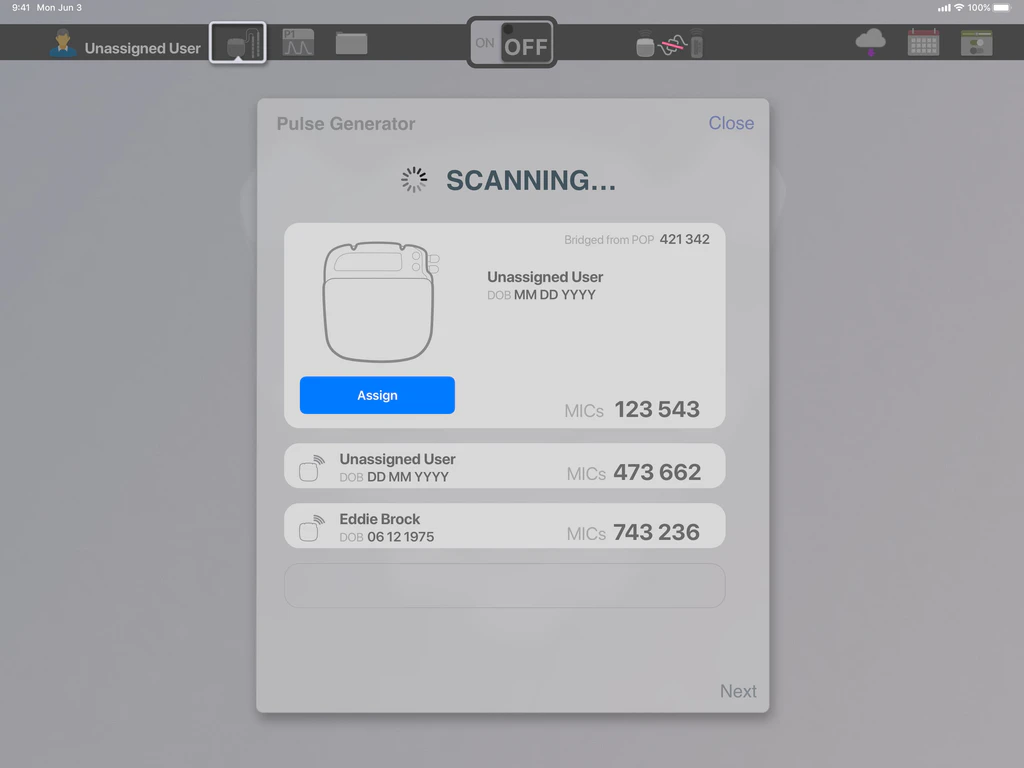
Scan

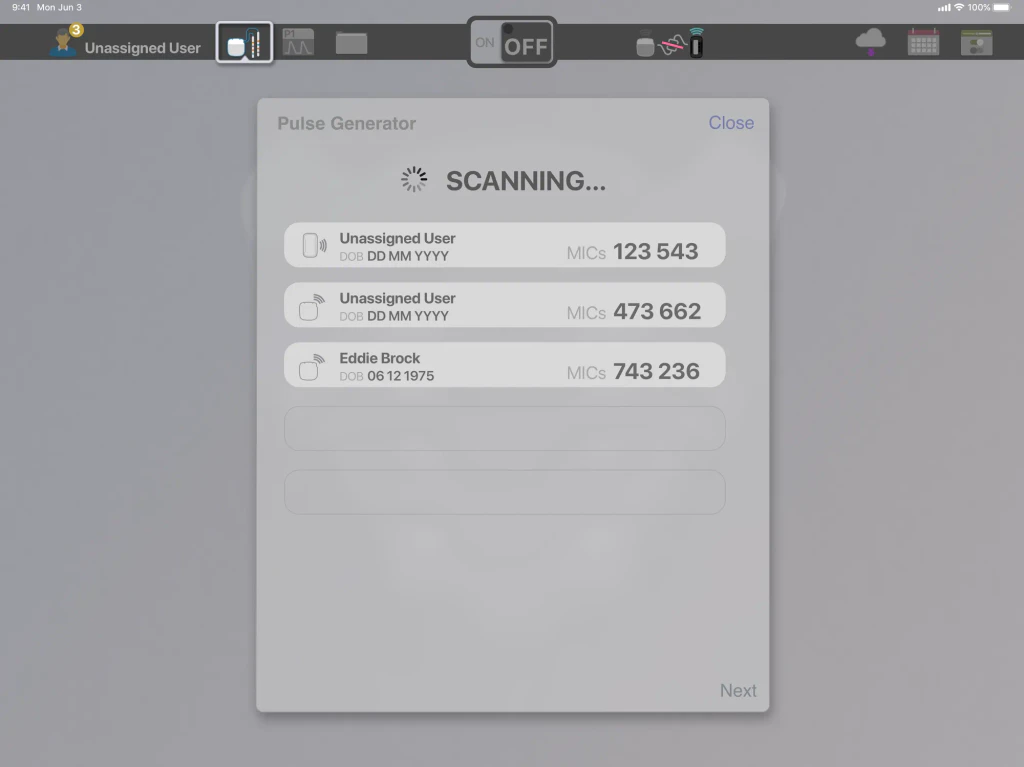
Scanning dialog listing three nearby implanted pulse generators by patient name, date of birth, and device number

Assign

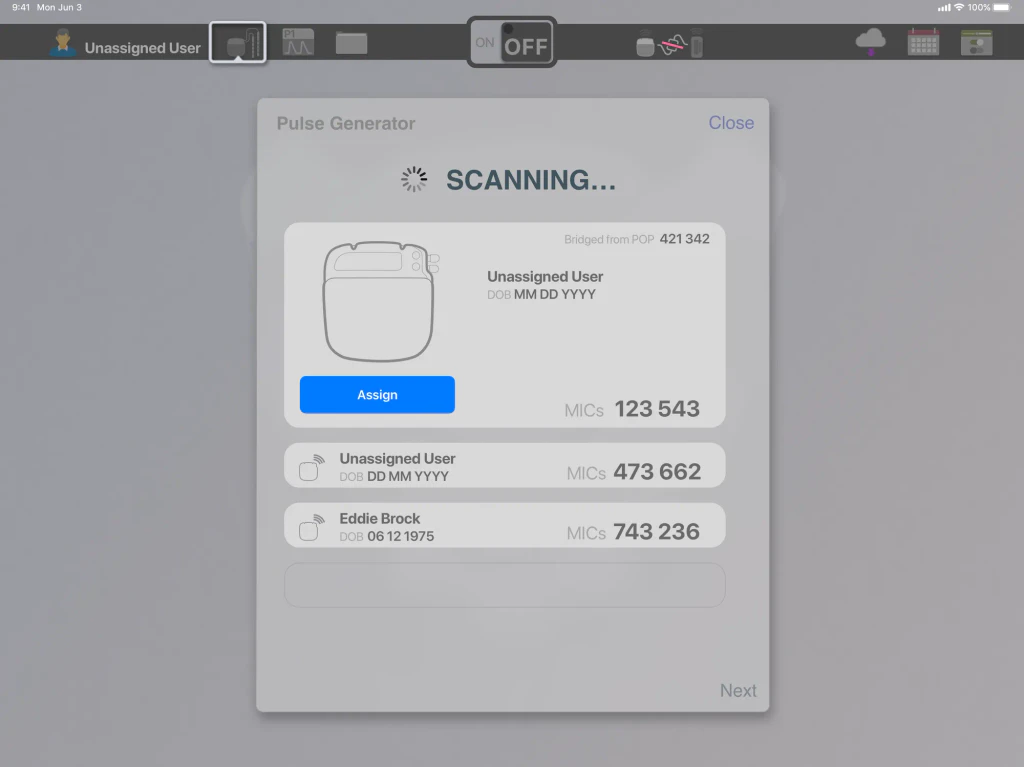
The same dialog with the first device expanded, showing the implant and an Assign button for the unassigned patient
Hardware-aware workflow: scan for nearby pulse generators, confirm the device, and assign it to a patient.

While building mock-ups and functional prototypes I created a library of visual assets. Their states were code-ready, so the prototypes could hand straight to engineering.
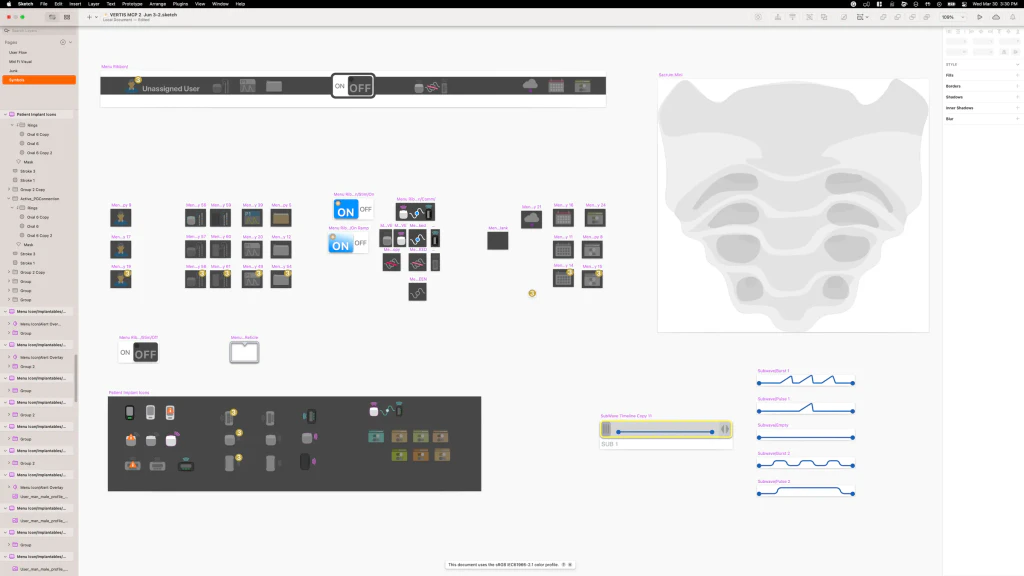
Sketch symbols page: status bar states, implant and hardware icons, sacrum illustration, and sub-program waveform components
The asset library: status-bar states, implant and hardware icons, anatomy, and sub-program waveform components.

Outcome

With no validation budget, I tested the early designs informally using working prototypes, A/B tests, and interviews.

+62%

User task performanceInformal early validation: working prototypes, A/B tests, and interviews.

Clinicians I interviewed preferred the new timeline paradigm for representing electrical fields and programs. The prototypes convinced major stakeholders and engineers that the new approach was better for the user.

Review

Working prototypes sell a complicated idea far better than static mock-ups. Inspiration can come from unusual sources: the timeline idea came from video editing, not medical devices.
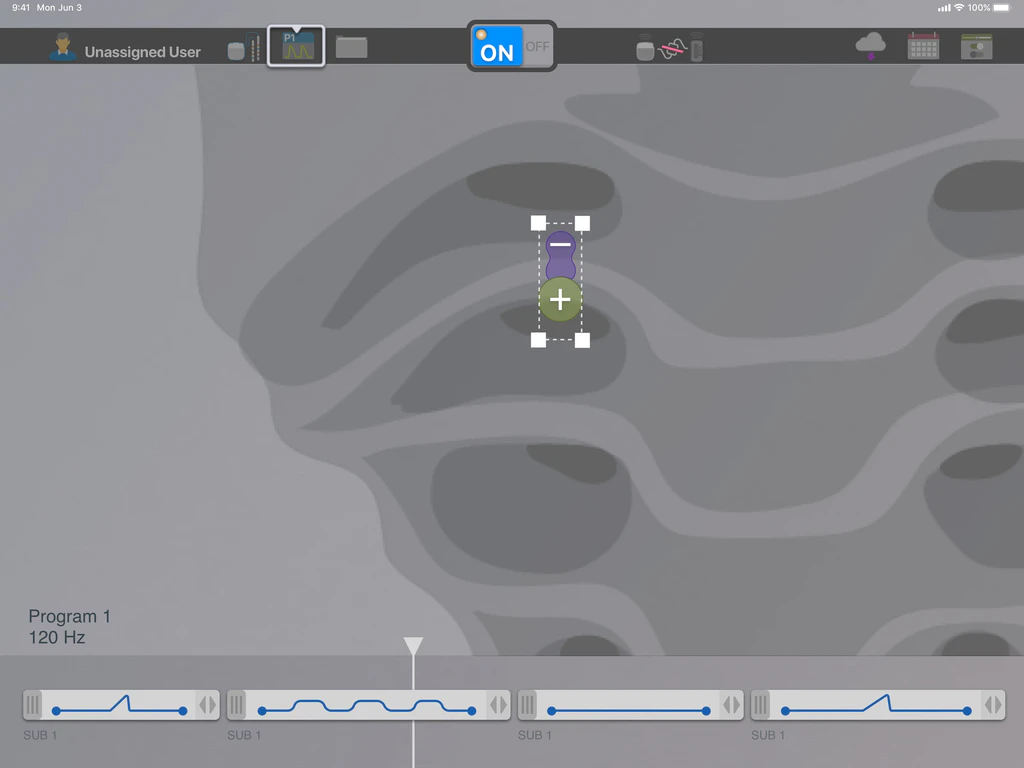
  • UI screenshot of programming view with bipolar lead selected on anatomy and four SUB 1 waveform panels under Program 1 at 120 Hz
  • User-flow diagram mapping interconnected screens for patient directory, new patient workflow, progress, summary, and appointment scheduling
  • User-flow diagram of programmer screens linked by yellow arrows across patient directory, progress, summary, and login
  • UI screenshot of Pulse Generator scan dialog with one device expanded showing Assign and a list entry for placeholder patient Eddie Brock
  • Pen sketch wireframe with toolbar icons, field panel beside lead contacts, and Program 1 as staggered sub-program clips with a play control
  • Two pen sketches of the app toolbar with tabs for patient, implant, leads, waveform, and notes, Leads selected in the second
  • Pen sketch of a field builder beside the sacrum and Program 1 drawn as three sub-program clips under a playhead

More user experienceAll work